HR Diagram
Announcing HR Diagram: A diagram showing types and evolution of stars
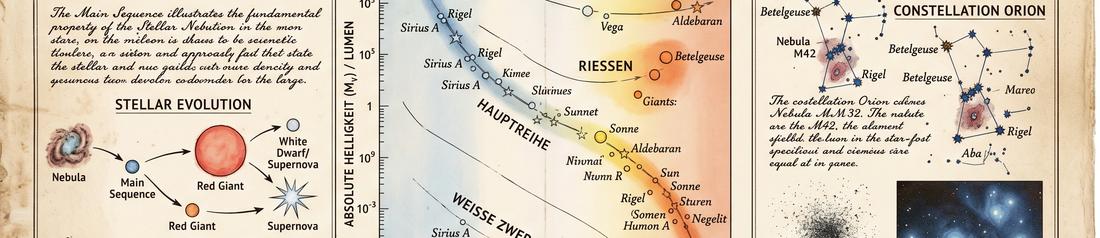
The Hertzsprung–Russell diagram is a classic of astronomy. It shows the different types of stars, on a chart with two axes.
Additionally this chart has animation, which shows how stars change over time.
Development
This started as a discussion with Claude about heat maps. Heat maps show averages of data, and I am finding that often on a heatmap one also want to show specific data, from a smaller set of samples.
At the start of the session I shared with Claude the code for doing InfoCards, and Claude was able to use that with no problem for the tooltips. Claude even provided custom css adaptations for the InfoCard on this chart.
I needed to prompt Claude to use the InfoCards not just for the stars but for the types of stars on the legend.
Current Status
This fulfils the original goals/prompt. Some time in the future I want to extract a general purpose heat map widget out of this. The combination of gaussian shading and individual 'twinkles' works well visually. So does the movement along path lines.
Log
- 29-Apr-2026: Launched
Made with Claude
This was made in a single session of interaction with Claude. I then added help, using the SaferCentaurs help library. I instructed Claude to only include 20 sample stars. That is enough to give a format for the stars. Other stars can later be included as data. They can be poured into the UI.