HR-Diagram - A Star Chart
I was exploring 'better ways to do heatmaps' and this diagram of evolution of stars came together from a discussion with Claude about it.
Safer Centaurs
Building open source artifacts - using small, composable pieces.
Code is on GitHub. Discussions on Discord.
I build small tools with AI assistance and write about the process.
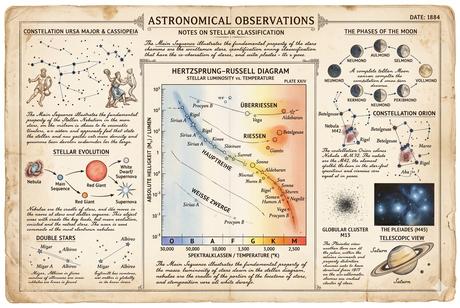
I was exploring 'better ways to do heatmaps' and this diagram of evolution of stars came together from a discussion with Claude about it.
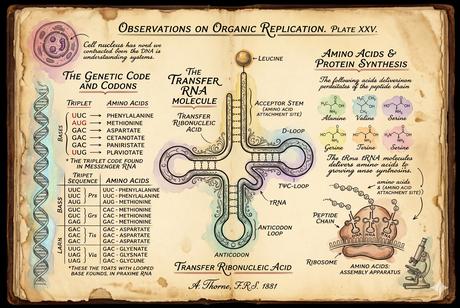
Claude was able to produce a custom app to show the relation between DNA sequence and protein sequence.
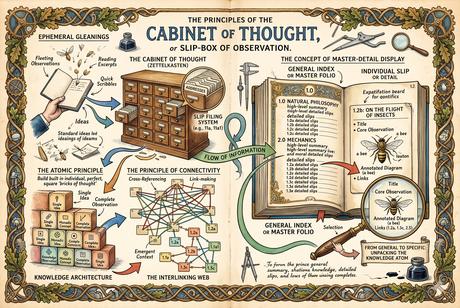
These tooltips have 'Optical Stability' and they stay out of the way. They provide a reusable master-detail paradigm that works well for dense data.
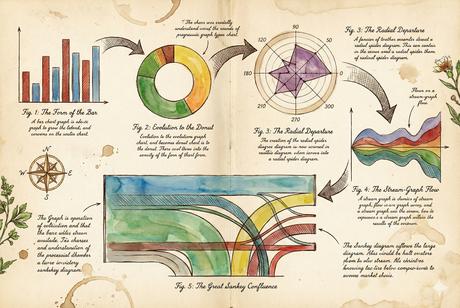
I needed 'the standard' chart types, pie chart, line chart, bar chart, spider plot, and decided to do them all in one. They morph into each other.
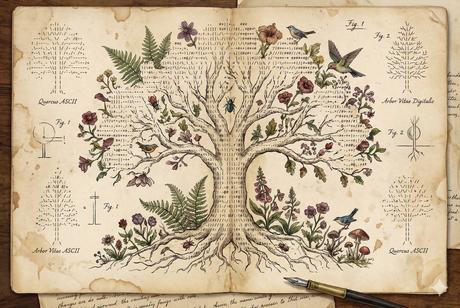
Using the box drawing
│,├, ─,└
symbols to make an ASCII-Art tree is fiddly and takes time. Claude one-shotted a small online tool to do it, from a single prompt.
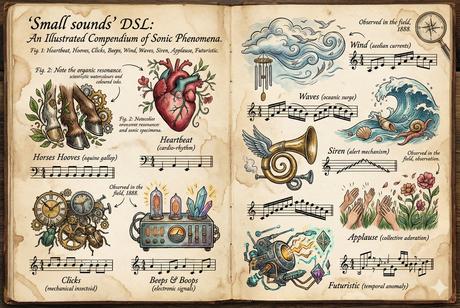
I didn't want to upload lots of different mp3 files. Instead I wanted to generate short simple sound effects, client side. This is the result.
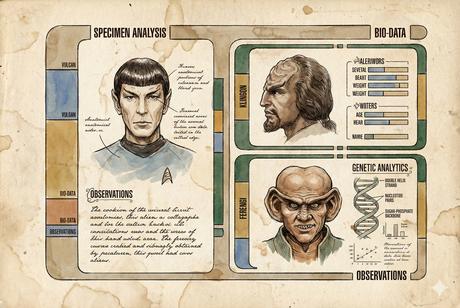
The LCARS user interface from Star Trek TNG actually has some desirable properties as a user interface.
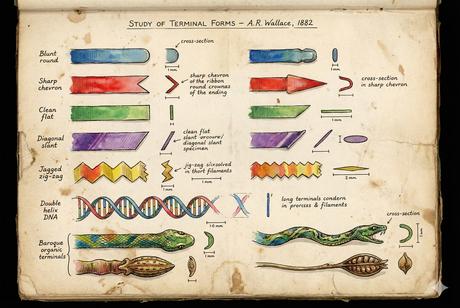
AIs struggle with understanding shapes. Here I got Claude to make tags with the end shapes I wanted.
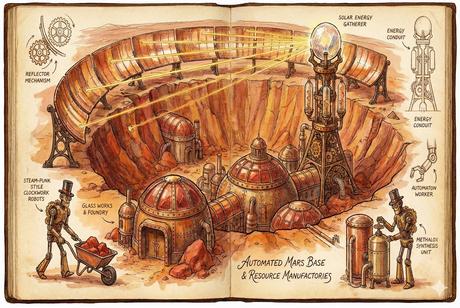
Cards are crucial to a software project I am working on. Here a spike solution begins to rework the card ideas, via a clicker-style Mars-base game. This code, co-produced with AI, helps to build a card based dashboard.
This spike solution also explores visual metaphors to track resource exchanges.